
For decades, the humble paper receipt was just a transaction’s tombstone. Proof of purchase, then straight to the wallet (or trash). But what if I told you that slip of paper—or its digital twin—is actually a goldmine? The real story isn’t the sale itself; it’s the data trail it leaves behind. Today, the most successful retailers aren’t just ringing up sales; they’re mining their Point of Sale data for insights that drive growth. This is the power of POS receipt data analytics for retail. Let’s break down how turning your transaction log into an intelligence engine can transform your business.
- POS data is more than revenue tracking; it’s a detailed record of customer behavior, product relationships, and sales trends.
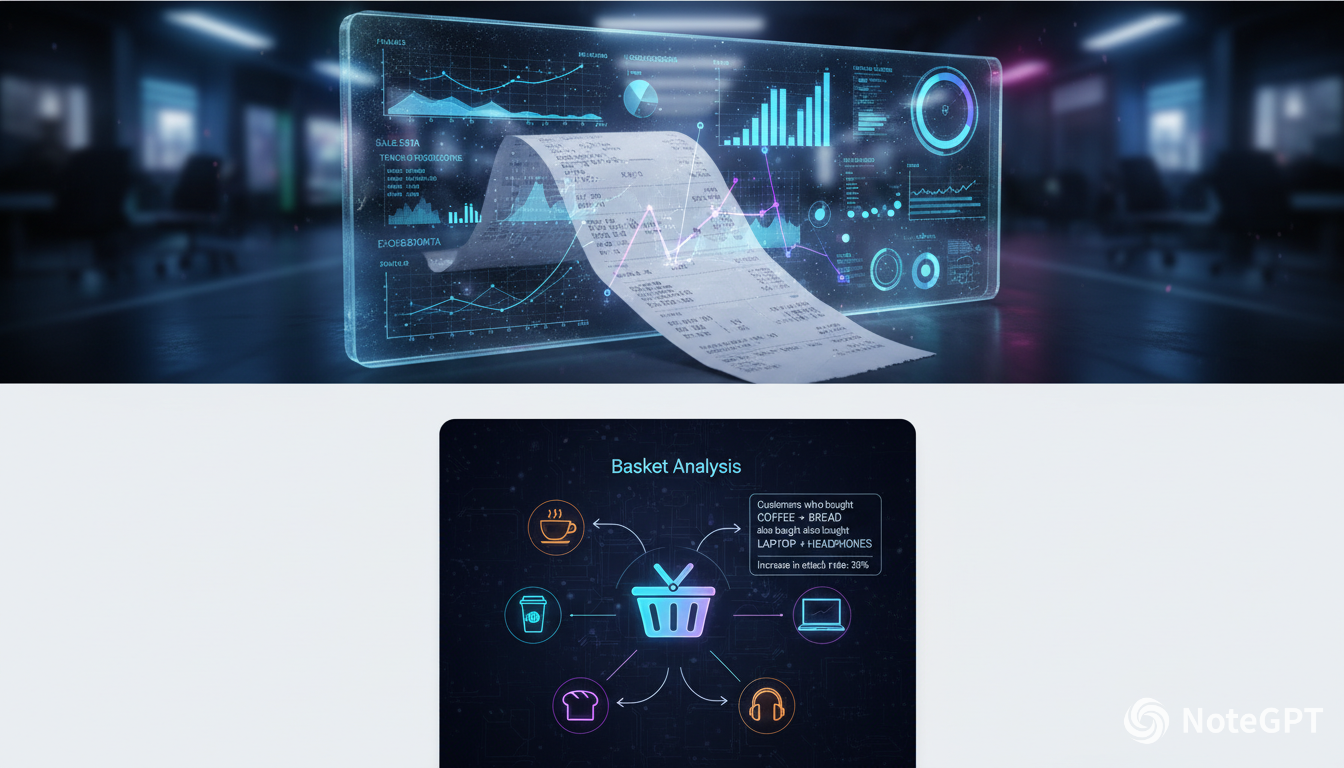
- Basket analysis reveals what products are bought together, unlocking opportunities for smarter bundling, cross-selling, and store layout.
- Identifying your true top sellers (by profit, not just volume) and flagging underperformers directly optimizes inventory and maximizes margin.
- Seasonal and time-based patterns hidden in receipt data allow for precise staffing, promotions, and inventory forecasting.
- Implementing a strategy around POS receipt data analytics is a direct path to increased average transaction value, reduced costs, and stronger customer loyalty.
Moving Beyond the Total: What Your Receipt Data Actually Holds
When we look at a receipt, we typically glance at the total and move on. But your POS system captures a multidimensional story in that data:
- Every Item Purchased: The core product catalog.
- Purchase Timing & Date: The exact hour, day, and season of the sale.
- Basket Combinations: What items were sold together in a single transaction.
- Price & Promotions Applied: What discount or offer secured the sale.
- Payment Method: A subtle indicator of customer preferences.
When you aggregate and analyze this data, you move from knowing what you sold to understanding why it sold and how you can sell more.
The Secret Weapon: Basket Analysis & Product Affinity
This is where it gets exciting. Basket analysis examines the items purchased together to find “affinity” pairs or groups. For example, your data might show that 65% of customers who buy premium coffee also buy a specific artisan pastry on Saturday mornings.
Actionable Insight: This isn’t just a fun fact. This intelligence allows you to:
- Create irresistible “complete-the-set” bundles or promotions.
- Train staff on effective, data-driven cross-selling prompts.
- Strategically place high-affinity products near each other to increase basket size.
Optimizing Your Inventory: Beyond the “Top Sellers” List
Your best-selling item by units might not be your most profitable. POS receipt data analytics helps you analyze performance by profit margin, seasonality, and turnover rate. You can quickly identify:
- Hidden Champions: Products with high profit margins that deserve more shelf space and promotion.
- Underperformers: Items that tie up capital and shelf space but don’t contribute meaningfully to goals. This informs markdown strategies or replacement decisions.
- Seasonal Shifts: Precise data on when specific items spike and fall, enabling just-in-time inventory ordering and reducing holding costs.
Predicting Patterns: Staffing, Promotions, and Customer Flow
Receipt timestamps are a crystal ball. Analyzing sales volume by hour, day of the week, or season reveals clear patterns. You can:
- Schedule Staff Precisely: Align your labor hours with peak transaction times, improving customer service during rushes and controlling costs during lulls.
- Time Promotions Perfectly: Launch flash sales or targeted offers during historically slower periods to boost traffic.
- Manage Peak Times: Prepare inventory and checkout resources ahead of predictable rushes.
Building a Smarter, More Profitable Retail Operation
Implementing a POS receipt data analytics for retail strategy turns intuition into strategy. It answers critical questions: What should I promote? What should I discontinue? How should I arrange my store? When do I need my best team on the floor?
The goal is a virtuous cycle: better data drives smarter decisions, which lead to improved customer experiences, higher efficiency, and increased profitability. It turns your POS system from a simple cash register into the central nervous system of your retail business.
Ready to Unlock the Insights in Your Receipt Data?
You’re already collecting this data with every sale. The opportunity is sitting in your system, waiting to be tapped. Start small: export your last quarter’s sales data and look for just one pattern—top-selling product pairs or your weekly sales peak.
Want to dive deeper? Let’s talk about how to structure your POS data analytics for maximum impact. [Contact our team today for a personalized consultation] or explore our resources on building a data-driven retail strategy.
Your next best-selling product combination is already in your history. It’s time to discover it.
Discover more from Start Entrepreneur Online
Subscribe to get the latest posts sent to your email.